How to create a simple image map with Storyblok
Storyblok is the first headless CMS that works for developers & marketers alike.
Storyblok has a set of native field types that, combined with the nestablility of the components, help to cover most of the editors’ needs.
Despite the native flexibility of the CMS, there are some content items that might be filled more easily with custom interfaces and the good news is that you can build them on your own and integrate them inside Storyblok.
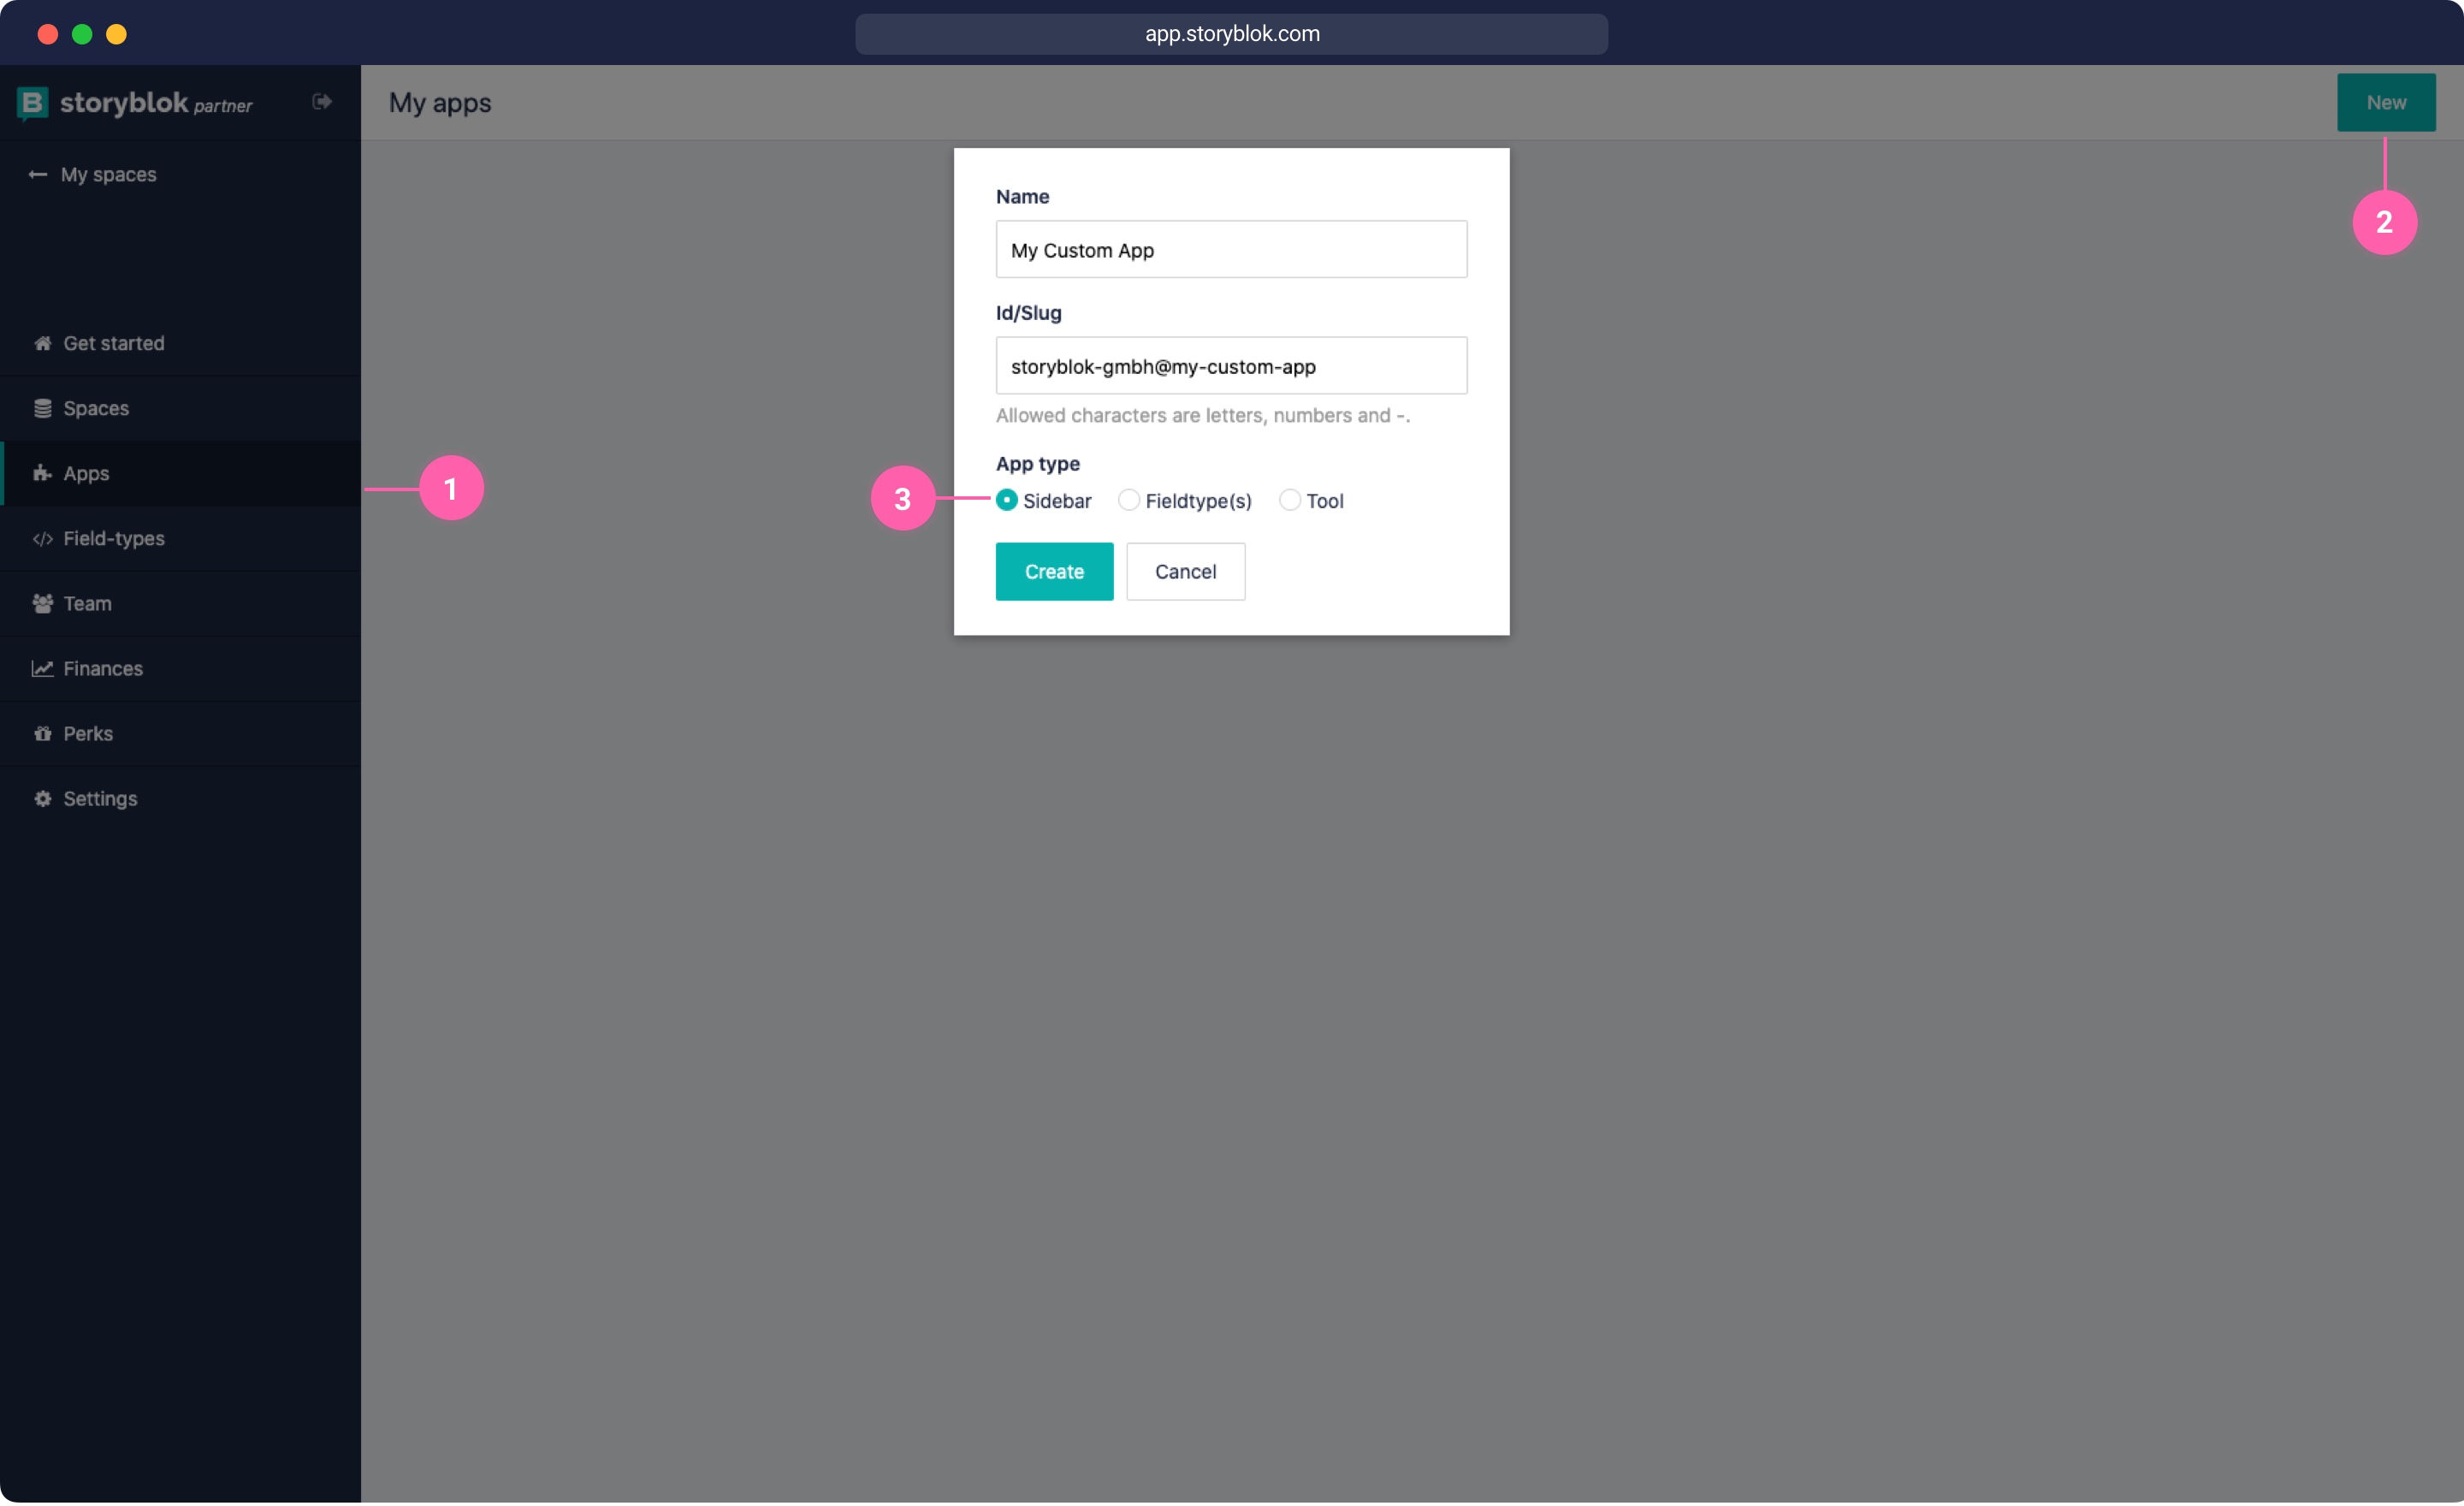
Custom field types in Storyblok are Vue.js components that can be used as fields inside the editor in the same way as the native ones.
In this article, we are going to see how to create an image map with a custom field type for our own website.
The problem and the solution
In the tutorials on our website, we have a lot of screenshots with annotations, which are simply overlapping circles with numbers and the numbers are referenced in the text of the article.
Example of an annotated image
For a long time, the authors of the tutorials have asked our designers to create such images with numbers. This process was requiring extra work and we saw an opportunity to save it with a custom field type. You can find the full code of the field type we are going to talk about here (opens in a new window).
The schema for image maps
When approaching the creation of a field type, it’s important to focus on what data we want to store and its structure.
In this specific case, we just wanted to store the URL of the image, the numbers, and their coordinates in relation to the width and height of the image. For this reason, our schema has a property called image that stores the URL of the asset and another one called mapNodes which is an array of objects containing the data of the numbers. There is also a property called plugin which is mandatory for custom field types and it contains the name of the field.
{
  "image": “image url”,
  "plugin": "sbi-annotated-image",
    "mapNodes": [
      {
        /* Node data */
      }
    ]
}
The schema of our field type
Now we can focus on the data of a single number. How do we store the coordinates of a point on the image?
We could simply save the coordinates in pixels, but if we have to update the image with another one with the same content and same ratio but different resolution the coordinates won’t fit the new one. There’s another problem: when we display the image on the website, if we don’t use its original size, the coordinates will be wrong.
For the above reasons, I chose to use a percentage of the width and height of the image. I decided to store these percentages as values between 0 and 1. If the image is 800 pixels wide, the value of the x will be 0 if the point is on the left-hand side border of the image and 1 if it’s on the right-hand side, and all the intermediate values in between the two edges.
In our case, since on the website we display a line going from the dot with the number to the point that we want to highlight, we also needed to store the direction its direction. For this purpose we have an extra property called direction that contains such information as a string of text
{
  "x": 0.11272727966308593,
  "y": 0.1098328480267076,
  "direction": "right"
}
The schema of a point on the map
The interface
First of all, we need something for uploading the image, and for this we can simply use the built-in assets selector that will display a button to upload an image and will store its URL as a string.
<sb-asset-selector :uid="uid" field="image"></sb-asset-selector>The asset selector component
We need also to add a button to reset the image and that will simply set the image property as an empty string.
export default {
  /* … */
  methods: {
    /* … */
    removeImage() {
      this.model.image = ''
    }
  }
}
The removeImage method of the image map field
After uploading the file, the user will have to place the numbers on the image. The simplest way for an editor to set a point on an image is to locate it and click on that, so the image has to be big enough for the user to spot the target.
For this purpose, we can display a modal with the image inside using the native one that we provide for custom field types.
The modal for custom field types
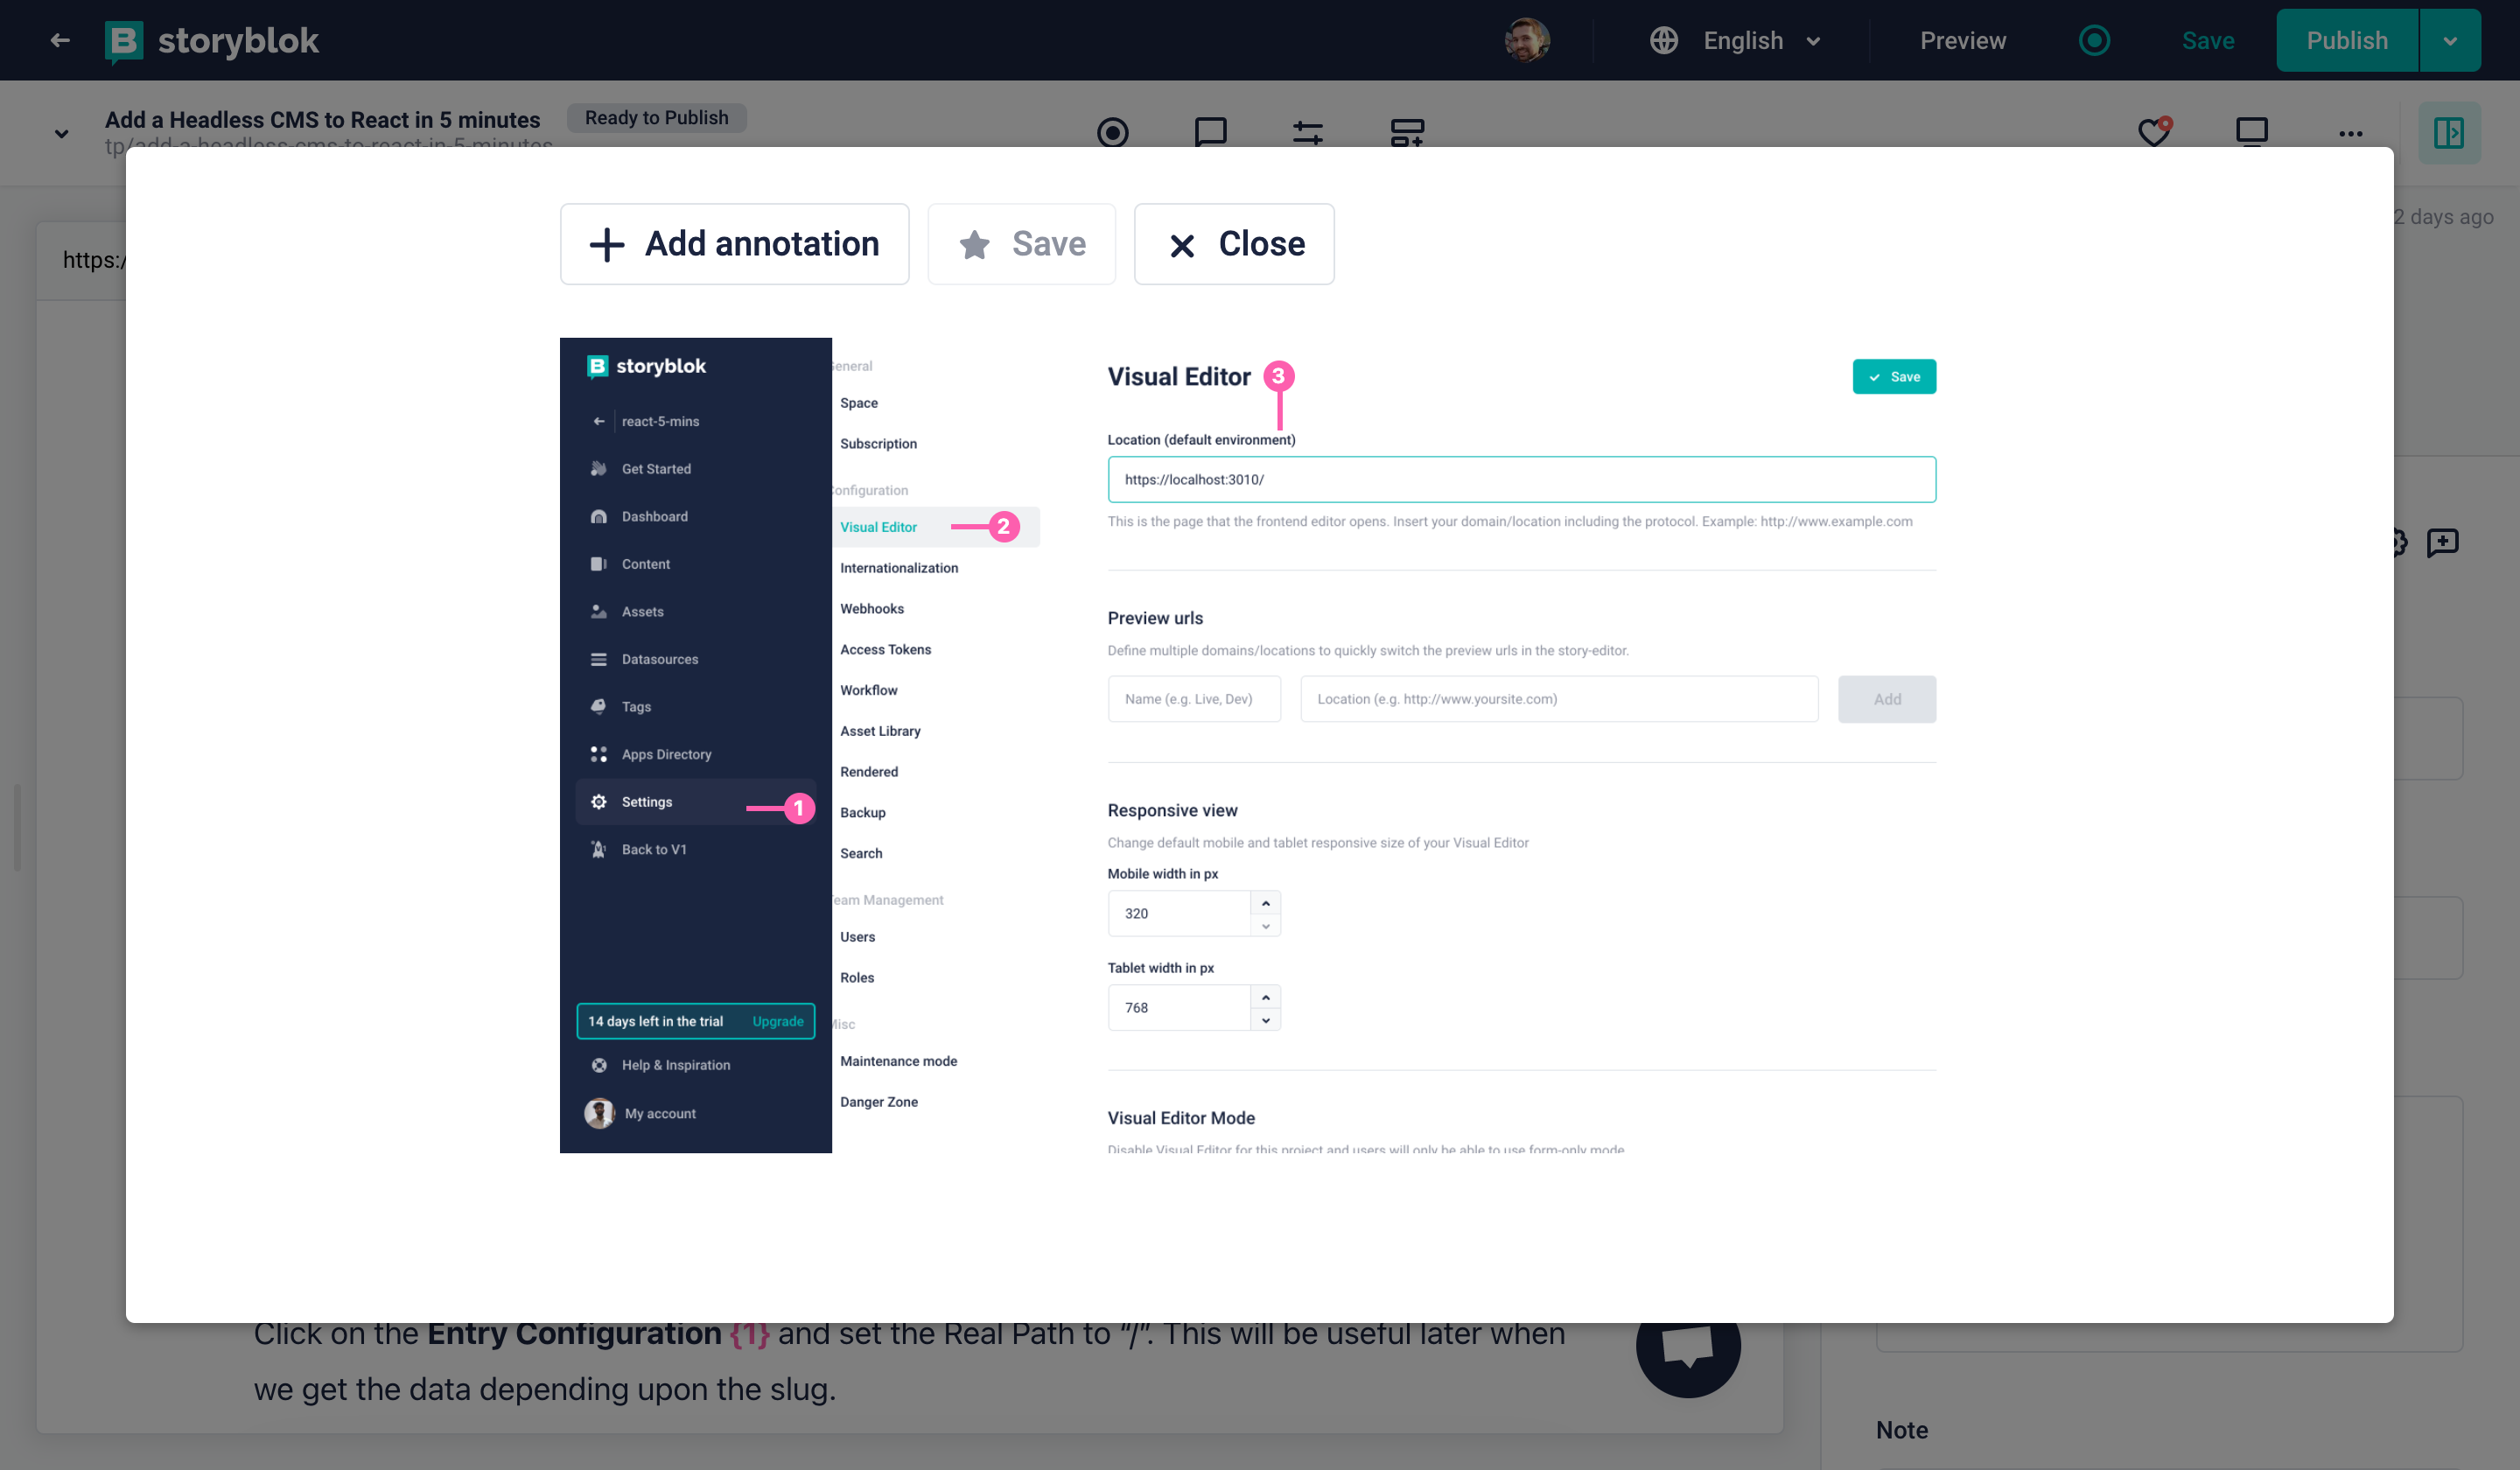
The interface also needs a button to add new nodes; a second one to save the changes, and the last to close the modal.
<!-- Modal -->
<div v-if="modalIsOpen" @mouseup= stopDraggingNode>
  <div class="sbi-image-map__modal-wrapper">
    <div class="sbi-image-map__modal">
      <!-- Controls -->
      <div class="sbi-image-map__controls">
        <SbGroupButton size="small" hasSpaces variant="ghost">
          <SbButton size="small" icon="plus" label="Add annotation" @click= addNode />
          <SbButton icon="star" size="small" variant="danger" :disabled="pendingChanges" label="Save" @click= saveChanges />
          <SbButton icon="close" size="small" variant="danger" label="Close" @click= closeModal />
        </SbGroupButton>
      </div>
      <!-- Map -->
      <div class="sbi-image-map__image-wrapper" @mousemove= dragNode>
        <img :src="model.image" class="sbi-image-map__image" ref="image" />
        <ul class="sbi-image-map__nodes">
          <li v-for="(node, index) in mapNodes" :key="index">
            <MapNode :number= index :dragging="isDragging(index)" :node= node @selectedNode="() => startDraggingNode(index)" @removeNode= removeNode @setDirection= setNodeDirection></MapNode>
          </li>
        </ul>
      </div>
    </div>
  </div>
</div>
Template of the modal component
We need to also write all the necessary code to listen to the clicks on the image, get the position of the cursor relative to it and get the value between 0 and 1 for each axis.
For dragging elements we could use ready-made libraries, but in our case, I simply opted for not using an extra package. One important thing to consider when getting the position of a point relative to an image is to make sure that it doesn’t get dragged outside of the borders. In that case, we should stop dragging that, preserving the last position on that axis. You can see this in the code below, which is the function that handles the dragging event.
dragNode(event) {
  if (this.dragging) {
    const imageRect = this.$refs.image.getBoundingClientRect()
    const delta_x = event.clientX - imageRect.left
    const delta_y = event.clientY - imageRect.top
    const x_coord = delta_x >= 0 && delta_x <= imageRect.width ? delta_x / imageRect.width : this.mapNodes[this.dragging_index].x
    const y_coord = delta_y >= 0 && delta_y <= imageRect.height ? delta_y / imageRect.height : this.mapNodes[this.dragging_index].y
    this.mapNodes[this.dragging_index].x = x_coord
    this.mapNodes[this.dragging_index].y = y_coord
    this.mapNodes = this.mapNodes.slice()
  }
},
The drag event handler
The interface of the custom field type
The frontend part
The custom field type is complete, we now have our array of coordinates and we just have to use it on our website.
We can use the coordinates in our frontend in different ways. In our case, we are just rendering the numbers as HTML elements that are absolute positioned over the image and then we use the left and top CSS properties, setting the value as a percentage.
{% for node in blok.source.mapNodes %}
    <div class="image__number" style="top: {{ node.y | times: 100 }}%; left: {{ node.x | times: 100 }}%;">{{forloop.index}}</div>
{% endfor %}
Outputting the coordinates in liquid
Wrapping up
We have covered all the most important items that you need to build a custom interface for image mapping. You can use this as a starting point to create more complex interfaces, for example for drawing polygons instead of defining points.
| Resource | Link |
|---|---|
| Annotated Image field type | https://github.com/storyblok/field-type-examples/annotated-image |
| Field types docs | https://www.storyblok.com/docs/plugins/field-type |
| Assets selector | https://www.storyblok.com/docs/plugins/plugin-proxy-components |
| Field types modal | https://www.storyblok.com/faq/how-can-i-open-my-custom-field-type-in-full-screen |
